India's Trade & Investement


India – Victoria – Merchandise Goods Trade Report for the period January – December 2021
-
1.Bilateral Trade Jan – Dec 2021
-
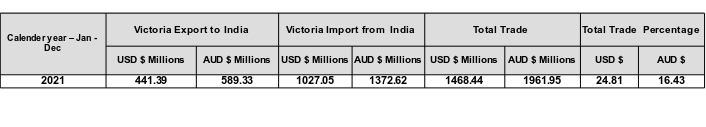
Victoria and India
Export
Import
Total
Victoria’s Trade with India ( AUD$ mn)
589.33
1372.62
1961.95
Victoria’s Trade with India ( USD$ mn)
441.39
1027.05
1468.44
ROE ( AUD$ to USD$ ) - Average taken
0..7489
-
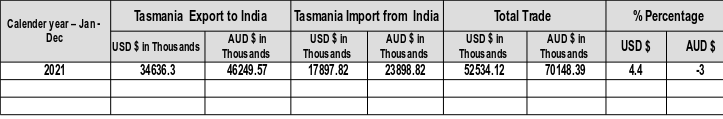
Tasmania and India
Export
Import
Total
Tasmania’s Trade with India (AUD $ thousands)
46249.57
23898.82
70148.39
Tasmania’s Trade with India (USD $ thousands)
34636.30
17897.82
52534.12
ROE ( A$ to US$ ) - Average taken
0.7489
-
2.Victoria - Trade figures
India – Victoria – Merchandise Goods Trade report for the period January – December 2021.
-
3.a) Victoria top 5 items - Export to India ( January – December 2021)
-
Sno.
Commodity
USD (in millions)
1.
Almonds, fresh or dried, whether or not shelled or peeled
88.20
2.
Shorn greasy wool (incl. fleece washed wool)
60.36
3.
Wood of coniferous species, in the rough, or roughly squared, but not treated with paint, stains or other preservatives, whether or not stripped of bark or sapwood
59.22
4.
Aluminium waste and scrap
37.2
5.
Ferrous waste & scrap
19.58
-
3.b) Victoria top 5 items - Import from India ( January – December 2021)
Sno.
Commodity
USD (in millions)
1.
Combined confidential items excluding some of SITC 28099 (exports only) and some of SITC 51099 (imports only)
75.3
2.
Diamonds
44.35
3.
Toilet and kitchen linen of cotton
30.5
4.
Bed linen, not knitted nor crocheted, of cotton
29.7
5.
Machinery and Equipment
24.21
-
Victoria major export destination: ( 2020-2021) China, United States, New Zealand, Japan,Singapore, Republic of Kora and United Kingdom.
-
Victoria major import sources: (2020-2021 Newzealand, china, Japan, Singapore and United Kingdom.
-
India – Tasmania – Merchandise Goods Trade report for the period January–December 2021.
- 4.Tasmania - Trade figures for past 3 years
-
5.a) Tasmania top 5 items - Export to India ( January – December 2021s)
-
Sno.
Commodity
USD
(thousands)
1.
Wood of coniferous species, in the rough, or roughly squared, but not treated with paint, stains or other preservatives, whether or not stripped of bark or sapwood
13502.3
2.
Unwrought aluminium
12658.38
3.
Ferrous waste & scrap
2600.45
4.
Parts, nes, for the machinery of group 723 and of subgroup 744.3 (excl. buckets, shovels, grabs & grips, bulldozer or angledozer blades, parts for boring or sinking machinery of headings 723.37 & 723.44 & parts of machinery of heading 723.48)
2140.65
5.
Cadmium, unwrought; cadmium waste and scrap; powders
1750.80
-
5.b) Tasmania top 5 items - Import from India ( January – December 2021)
-
Sno.
Commodity
USD
(thousands)
1.
Flours, meals and pellets, of fish or of crustaceans, molluscs or other aquatic invertebrates, unfit for human consumption, for feeding animals.
9648.52
2.
Organo-inorganic compounds)
compounds,
nes
(excl.
mercury
4650.35
3.
Combined confidential items
2845.10
4.
Tyres, pneumatic, new (excl. motor cars, buses or lorries, aircraft, motorcycles & bicycles) with herring-bone or similar tread
675.82
5.
Bentonite
375.25
-
Tasmania major export destination: (2020-2021 China, Japan, Korea, Thailand,Singapore and USA.
-
Tasmania major import sources : ( 2020-2021) China, Japan, Newzealand, Singapore,United Kingdom and Germany.
Doing Business in India
- Indian Trade Portal

- Indo Aus chamber of Commerce
- Confederation of Indian Industry (CII)
- Federation of Indian Chambers of Commerce and Industry (FICCI)
- Federation of Indian Exporters Organisations (FIEO)
- The Associated Chambers of Commerce and Industry of India (ASSOCHAM)
- Textile Export Promotion Council
- Apparel Export Promotion Council:
- Public Private Partnerships
- Export Promotion Councils
- Commodity Boards and PSUs
- Organization of Pharmaceutical Producers of India
- Federation of Indian Mineral Industries
- PAN application
- Foreign Investment in India
- The Institute of Companies Secretaries of India